
| ||||||
 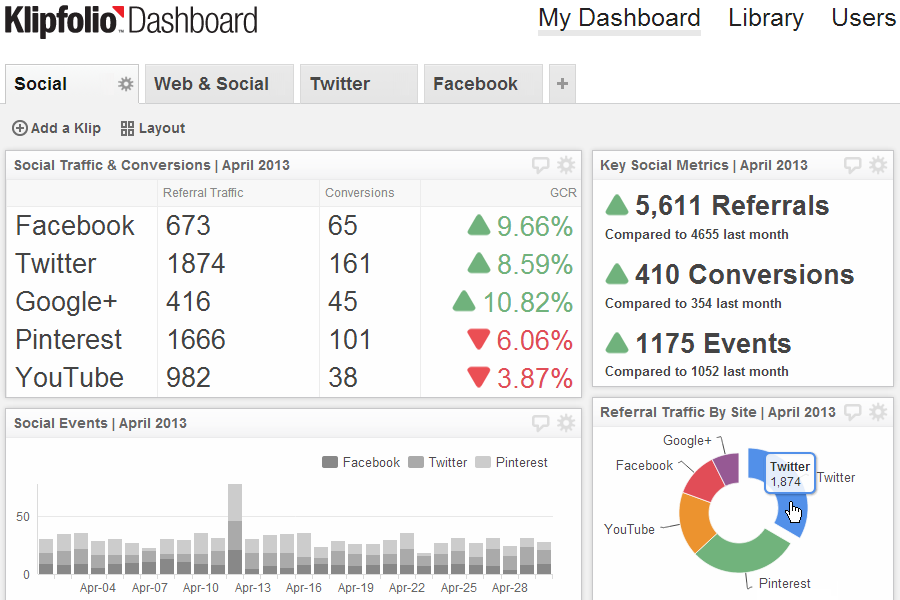 | 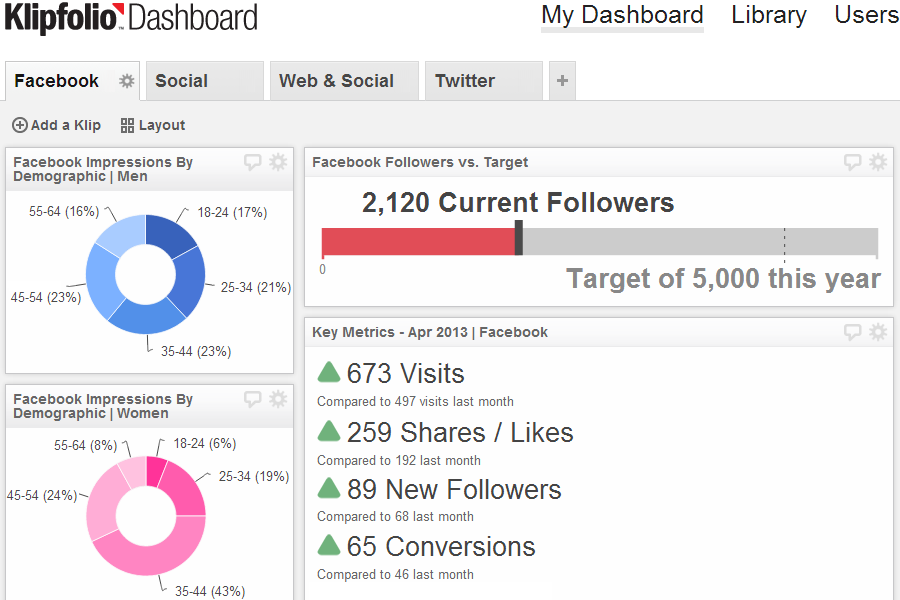 | 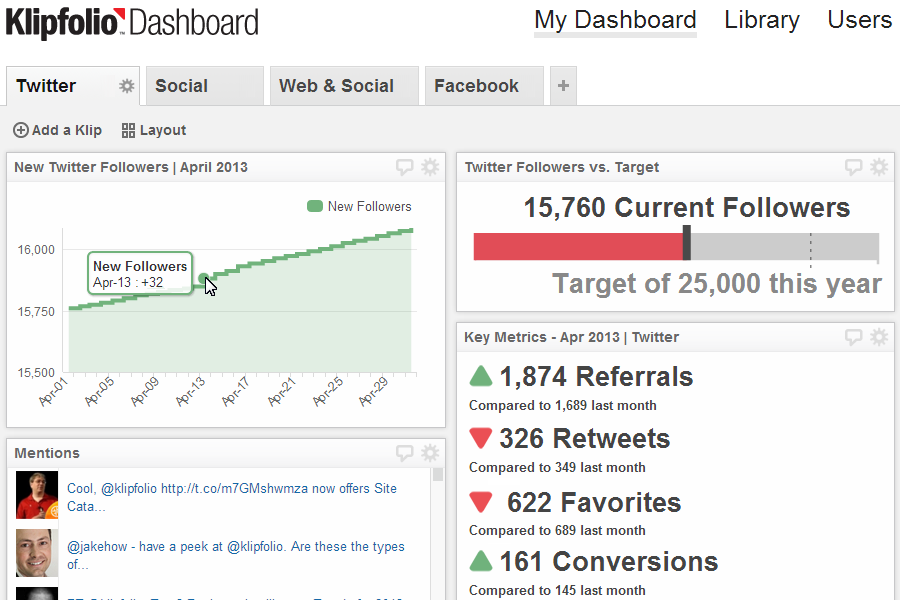 | ||
All insights in one placeYour social-media marketing efforts may span across a multitude of platforms and profiles. A social media KPI Dashboard consolidates that data from each profile into one template to give you a clearer view of your performance. | Know your audienceCreating compelling content for social-media sites like Facebook is about understanding your audience. With a social-media KPI Dashboard, you have the graphic insights you need to craft a compelling message that resonates with your audience. | Never miss a beatWhen a customer mentions you in a Tweet, you want to be able to jump into the conversation without missing a beat. A social-media KPI Dashboard gives you instant real-time updates so you are always ready to engage. |
| ||||||
Return on InvestmentThis example provides an honest assessment of your performance so you know which campaigns are generating the most revenue. ROI is one of the most definitive measurement to use when assessing the real, bottom line success of your venture. The social-media KPI Dashboard template gives you the ROI information you need on a real-time basis.. Benefit: Know the value of each dollar you invest in SEO. Audience: Clients, Marketers. Calculation: (Attributable Revenue - Campaign Investment) / (Campaign Investment) = ROI (over X time period) Example: ($1.0 M Revenue - $0.5 M Invest) / ( $0.5 M Invest) = $0.5 M ROI over past 90 days | Click-through rateClick-through rate (CTR) demonstrates the effectiveness of your SEO campaign to turn keyword rankings into real results. Even a rank 1 keyword can under-perform on its click-through rate, so you can't take a high ranking for granted. A social-media KPI Dashboard can monitor your click-through rate so that you can ensure that you are getting the results you want.. Benefit: Know that keyword ranking isn't everything, and ensure your content is compelling to searchers. Audience: Marketers, Clients. Calculation: Keyword: Search Volume / Actual Volume = CTR % Example: Fish and Chips (673,000 per month / 100,000 per month) = 14.85% CTR | Goal conversion rate.You have to measure your goal conversion rate. Even if your keywords are highly ranked and you have a high CTR, your ultimate objective is to have visitors to your site complete a desired task. This can be filling out a lead form, making a donation to your charity, signing up for your newsletter, or purchasing a product. Your KPI Dashboard will let you see how well your site is doing. Benefit: Know if your SEO efforts are paying dividends and helping you to achieve your goals. Audience: Marketers, Clients. Calculation: # of page visits / # of goals completed Example: 1000 visits / 50 goals = 5% GCR | ||
Highest ranked URLThis is an important measurement to monitor and analyze along with with other data to provide an accurate in-depth perspective of the performance of your SEO campaign. Having this information available in real-time can have a direct impact on the effectiveness of your campaign to attract and retain customers. Benefit: Know if the right URLs are ranking high for the right keywords. Audience: Marketers. Calculation: Identify highest ranked URL for each keyword. Example: "Fish and Chips, rank #1, URL: www.fishandchips.com/menu | Hospital bed occupancy rateThis KPI measures how effectively you are using hospital facilities over a specified period of time. As with any of the KPIs on this list, occupancy rate can fluctuate greatly from one period to the next and from one hospital to another. Your goal with this KPI is to set up a value as an acceptable norm so you can determine why rates are high or low. This KPI is a bit of a Goldilocks scenario, where too few beds can impact patient satisfaction and outcomes, and too many beds available points to an inefficient use of resources. Benefit: Know how effective you are at managing hospital resources. Audience: Decision-makers Calculation: (Total beds (x days) / inpatient days of care (x days) ) * 100 = Rate% / x days Example: 200 Beds (90days) / 170 inpatient (90days) = .85 or 85% / past 90 days | Average length of stayThis KPI measures how long, on average, patients stay in your hospital. This metric can vary widely based on what type of facility you are operating (long term care vs short term) and what type of medical conditions are involved. Once you've gathered your data, you can concentrate on investigating why your number is what it is and showing it in this KPI. Is it influenced by hospital acquired infections, or by excellent healthcare service? Calculating this KPI is straightforward, but it is important to give each patient a base-value of 1 to account for all visits, even if they are not overnight.Benefit: Know how long patients stay at your facility and find out why that is. Audience: Decision-maker, healthcare providers Calculation: (Date of admission - Date of discharge) Example: 4 days is the average length of stay | ||
Search analysisSEO is one of the most effective ways to increase traffic volume to your website, but it isn't the only way, and it may not necessarily be the best way. Your data-driven KPI Dashboard measures and displays your results so you're not driving blind. By knowing what percentage of your site traffic comes from searches you can measure ROI and determine how to most effectively invest in SEO campaigns. Benefit: Know where site traffic is coming from and invest accordingly. Audience: Marketers, Clients. Calculation: Total site traffic / Organic search Example: 25,000 / 17,500 = 70% | Keyword opportunitiesYour SEO KPI Dashboard can show you which keywords represent the best opportunities for you to have the most effective SEO strategy. Using Google Adword's Keyword Tool, you can see competition for a keyword, estimated search volume, and suggested keyword phrasing. You can also check Google's search insights for the keyword, and gauge potential future search volume for the keyword. Gathering all of this information into your KPI Dashboard will give you a leg up on meeting your objectives. Benefit: Know which keywords hold potential for your business and align your priorities. Audience: Marketers, Clients. Calculation: Qualitative measure (estimated search volume, competition, and trends). Example: Local fish and chips (673,000 per month, low competition, trending high). | Search impressionsThis SEO KPI Dashboard measures and displays the amount of times your website has appeared in search queries. It is an effective way to gauge the visibility of your website and the ability of your campaign to generate interest. Bring your source data into your dashboard for up-to-date analysis and interpretation. Benefit: Understand the visibility of your site, and optimize all of your content to generate a high CTR. Audience: Marketers. Calculation: # of impressions Example: 35,000 impressions |
| Dashboard Information | Industry Dashboards | Department Dashboards | About Us | Legal |
| Connect Your Data Visualize Your KPIs Monitor Your KPIs Share With Colleagues Cloud Hosted Data Security Mobile Access Real-Time Data Visibility Operational Intelligence Consolidate Key Metrics | Call Centre Dashboards Retail Dashboards Financial Services Dashboards Insurance dashboards Health Care / Medical Dashboards Manufacturing / Supply Chain Dashboards | Sales Dashboard Marketing Dashboard Executive Dashboard Web / Social Dashboards | Professional Services Klipfolio Partnership Contact us | Privacy Policy Terms and Conditions Data Security |
| Copyright © 2016 Data Geeks. All Rights Reserved. | ||||