
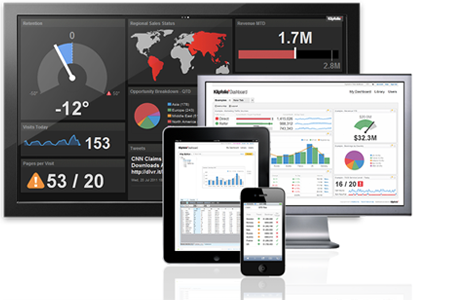
Real Time Performace Dashboards
Menu
  • External link opens in new tab or window
    • External link opens in new tab or window
    • External link opens in new tab or window
    • External link opens in new tab or window
    • External link opens in new tab or window
    • External link opens in new tab or window
    • External link opens in new tab or window
    • External link opens in new tab or window
    • External link opens in new tab or window
    • External link opens in new tab or window
    • External link opens in new tab or window
    • External link opens in new tab or window
  • External link opens in new tab or window
    • External link opens in new tab or window
    • External link opens in new tab or window
    • External link opens in new tab or window
  • External link opens in new tab or window
    • External link opens in new tab or window
    • External link opens in new tab or window
  • External link opens in new tab or window
    • External link opens in new tab or window
    • External link opens in new tab or window


Data Visibility. Expose the KPIs you need to see with Dashboards.


All successful businesses use Key Performance Indicators to measure progress. In the past, most key indicators were not available in real time. With a KPI Dashboards you are able to stay up-to-date on your company's actual performance, and effect positive change immediately. KPIs used to be history. Your KPI Dashboard turns them into current events.


A picture is worth a thousand words


Everyone knows that old proverb, but few utilize its truth in operating their business.  Many employees do not know how to read raw data reports.  Some are too embarrassed to admit it, so they pretend that they can.

Converting KPI data to graphic presentations helps you to mentor your employees as to what is really important and to gauge how successful they are.  It's also easier for you to visualize the bigger picture.

Picture-perfect performance


People respond to graphics much more effectively than they do to line after line of printouts.  When they can actually "see" what is going right or wrong, especially in real-time, they become enabled to act immediately and effectively.


Next Page: Operational Intelligence


Dashboard InformationIndustry DashboardsDepartment DashboardsAbout UsLegal
Connect Your Data
Visualize Your KPIs
Monitor Your KPIs
Share With Colleagues
Cloud Hosted
Data Security
Mobile Access
Real-Time
Data Visibility
Operational Intelligence
Consolidate Key Metrics
Call Centre Dashboards
Retail Dashboards
Financial Services Dashboards
Insurance dashboards
Health Care / Medical Dashboards
Manufacturing / Supply Chain Dashboards
Sales Dashboard
Marketing Dashboard
Executive Dashboard
Web / Social Dashboards
Professional Services
Klipfolio Partnership
Contact us
Privacy Policy
Terms and Conditions
Data Security  
     
Copyright © 2016 Data Geeks. All Rights Reserved.
 

close lightbox