
| ||||||
  |  | |
Round-the-clock visibility important indicators
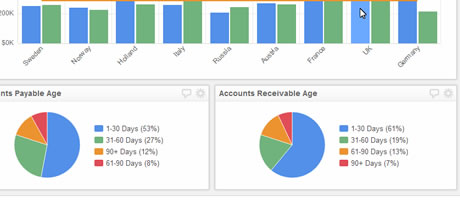
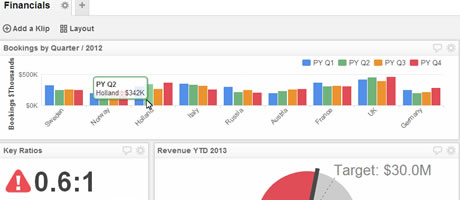
The world's most profitable financial companies operate a performance-driven culture. With a KPI Dashboard executives can effectively consolidate sales, risk, debt, and equity metrics. Managers can monitor their sales, receivables, client risk profiles, new customers, and churn. KPI Dashboards are available to for every department and at every level. | Real time operational KPIsKPI Dashboards make it easy to monitor performance with elegant, graphic presentations that are available as a sidebar on employee desktops, in the boardroom, or on your mobile tablet or smartphone. Real-time metrics available at all times |
| ||||||
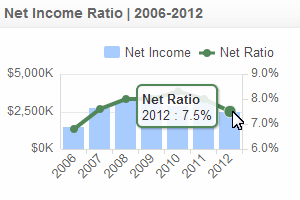 |  |  | ||
Net income ratioHow effective is your company at generating profit on each dollar of earned premium? This graphic will show you how well you are doing, and may lead you to make important strategic adjustments.
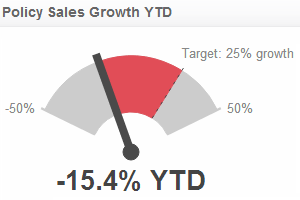
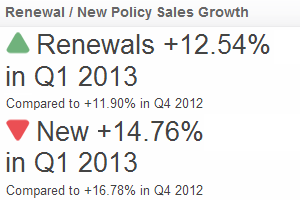
| Policy sales growthLike looking at a speedometer, this graphic lets you understand at a glance how fast you are growing. You can benefit from this KPI Dashboard information for asset allocation and staffing requirements as well as for other strategic action. Audience: Executives, Brokers Calculation: (Current period sales revenue - Previous period sales revenue) / Previous period sales revenue | Sales growth percentageWant to know your renewal and retention rates? One glance at this KPI Dashboard graphic and you will know immediately, not just the rate, but also see it compared to historical data.
|
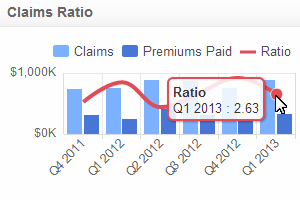 |  |  | ||
Claims ratioInsurance fraud is a reality. This KPI Dashboard graphic could help you detect when someone is trying to defraud you. You will be instantly aware when your KPIs indicate an unusual spike in claims versus premiums, alerting you in time to avoid potential losses.
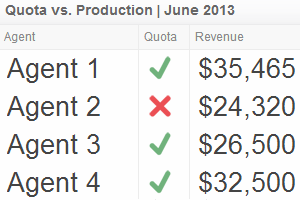
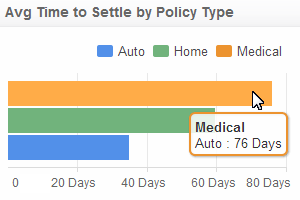
| Quotas vs productionYour business is built on agent productivity. With a real-time, data-driven KPI Dashboard you can quickly and easily monitor agent performance. You can congratulate where appropriate and encourage where necessary, before the month is over. It's not just about having the data. It's about being able to do something with it in a timely manner. Audience: Executives, Brokers Calculation: (Total $ Quoted Business / Total Revenue) | Average settlement timeAverage time to settle a claim may be more important to your customer than to you. That is, until it takes too long to settle a claim and you lose that customer. Use this KPI Dashboard information to make certain your team is satisfying your customers by settling their claims as quickly as possible.
|
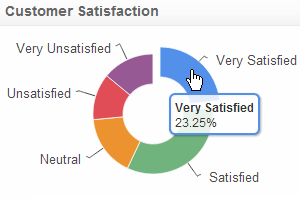 |  |  | ||
Customer satisfactionOne of the hardest things to measure is customer satisfaction. It is often too subjective to adequately measure and it takes too long to gather the information in time to use it effectively. This graphic can keep real-time customer satisfaction details visible to your entire team.
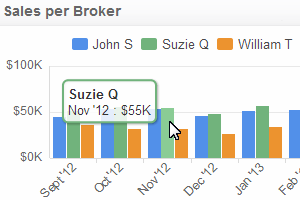
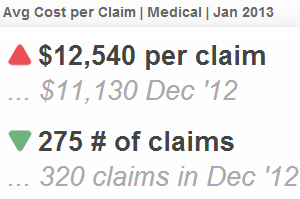
| Sales per brokerWith a KPI Dashboard comparison of sales by broker, you will be able to better understand where you need to focus your attention to improve your business. You will also be able to see cycles and patterns that affect one or all of your brokers. Audience: Executives, Brokers Calculation: Rank top 3/10/25 brokers by sales revenue per policy type | Average cost per claimThe reality is that you can probably expect the average cost per claim to increase over time. Being able to monitor the indicators in real-time allows you to make the necessary adjustments to ensure your continuing profitability.
|
| Dashboard Information | Industry Dashboards | Department Dashboards | About Us | Legal |
| Connect Your Data Visualize Your KPIs Monitor Your KPIs Share With Colleagues Cloud Hosted Data Security Mobile Access Real-Time Data Visibility Operational Intelligence Consolidate Key Metrics | Call Centre Dashboards Retail Dashboards Financial Services Dashboards Insurance dashboards Health Care / Medical Dashboards Manufacturing / Supply Chain Dashboards | Sales Dashboard Marketing Dashboard Executive Dashboard Web / Social Dashboards | Professional Services Klipfolio Partnership Contact us | Privacy Policy Terms and Conditions Data Security |
| Copyright © 2016 Data Geeks. All Rights Reserved. | ||||