
| ||||||
 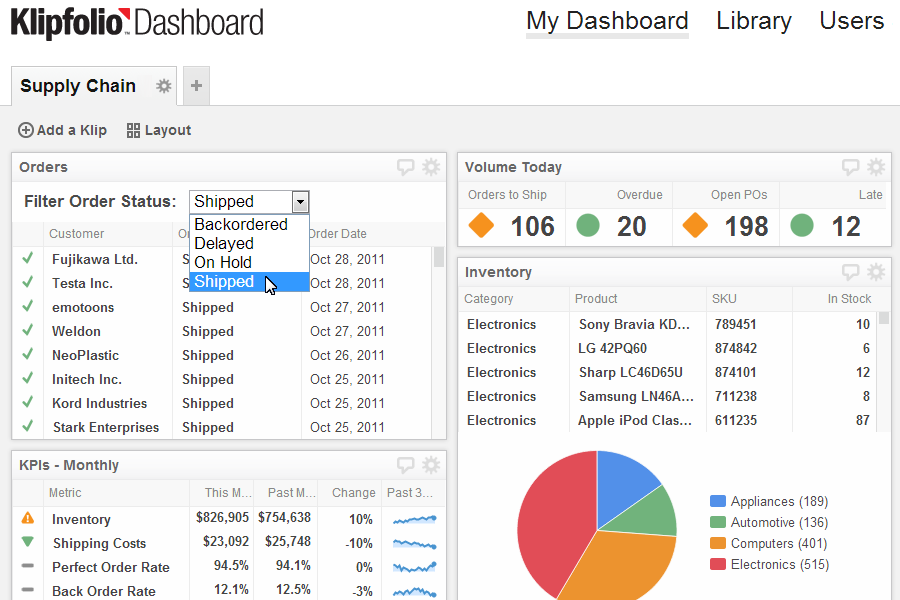 | 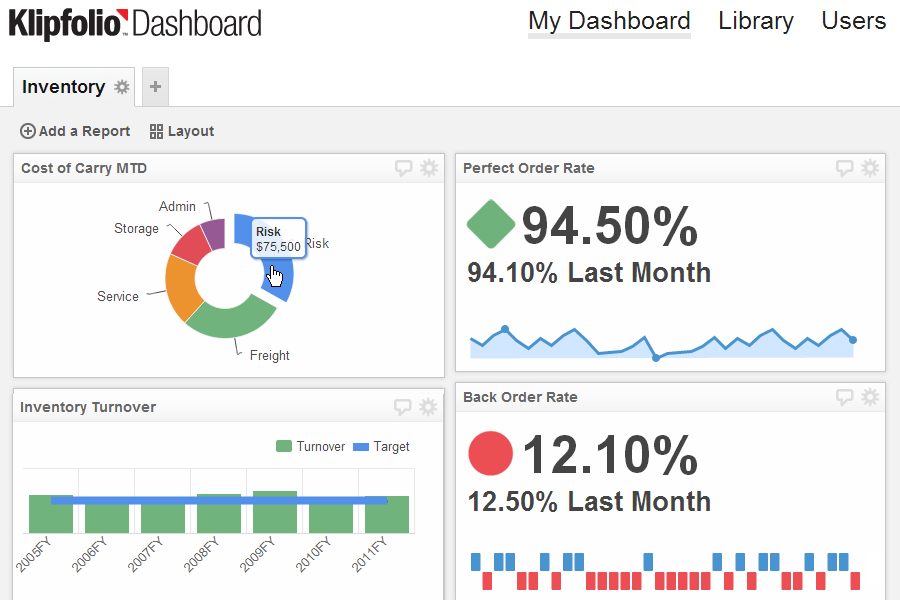 | 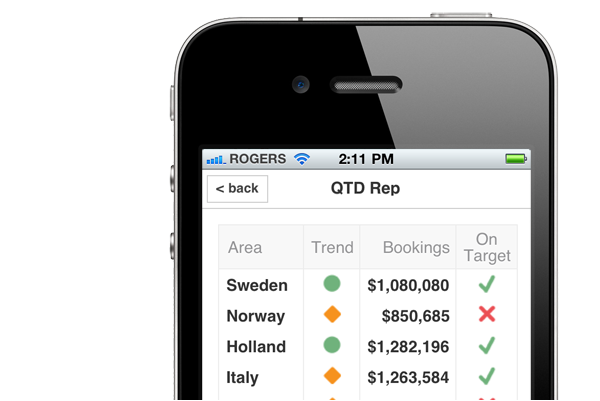 | ||
See the big pictureThe challenge facing your organization is managing all of the components of your supply chain, from procurement to receipt. A supply chain KPI Dashboard helps you see the big picture by viewing all the most important KPI at one time. | A real time perspectiveYou KPI Dashboard shows you what needs attention right now. The quicker you can respond to issues, the quicker they can be resolved. Never has there been a more effective supply chain tool that the real-time KPI Dashboard. | Mobile accessibleManaging your supply chain means that you're often on the go, inspecting warehouse activities, meeting with suppliers or visiting customers. That's why you need a supply chain dashboard that is accessible on any mobile device. No matter where you are, you can always see the status of your operations. |
| ||||||
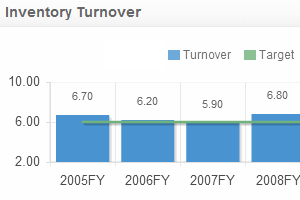 |  |  | ||
Inventory turnoverInventory turnover is one of the important, yet one of the most neglected, performance metrics. With a KPI Dashboard you can raise awareness at all levels of the company, especially in Purchasing and in Sales.
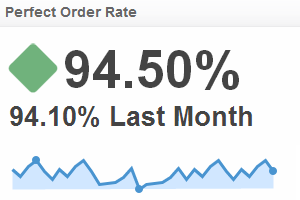
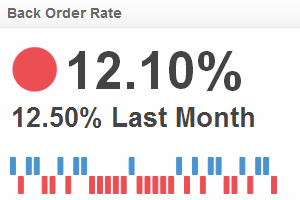
| Perfect order rateThis inventory KPI Dashboard is closely related to customer satisfaction as it measures your ability to put together a perfect order. By combining the statistics of shipping without damage, delivering the shipment on time, invoicing the order correctly, and ensuring the accuracy and completeness of the order you will understand the efficiency of your warehouse and the ability of your organization to exceed customer expectations. Audience: Front-line, Managers, Executives Calculation: # of errors per order / total # of orders = Order Rate | Back order rateNow you can see in real time what your back order rate is and be instantly alerted to indications of supply chain problems. The bottom line is that back orders often get cancelled. That is lost revenue. This simple graphic can help your procurement staff better understand their priorities.
|
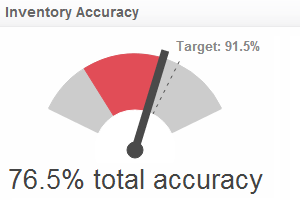 |  |  | ||
Inventory accuracyThe accuracy of your inventory - actual versus book - can make or break your business over the long haul. This graphic will warn you that you may have a problem in either receiving, shipping, inventory identification, or accounting.
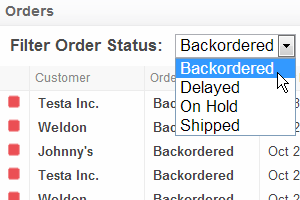
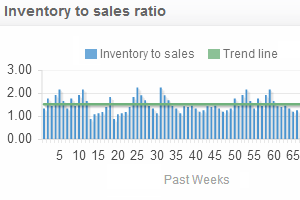
| Order statusThis graphic reveals the status of all orders in your system and prioritizes them according to urgency. Making this real-time information available to sales, warehouse, purchasing, inventory control, customer service and accounting through your KPI Dashboard will drive your efficiency and improve productivity. Audience: Managers, Executives Calculation: Anecdotal information: date order placed, current order status, shipment due date. | Inventory to sales ratioCarrying too much inventory can be just as crippling as having too little. Setting, and performing to, optimal metrics will make profitability much easier than unnecessarily tying up your money in too much inventory or losing sales because of too little.
|
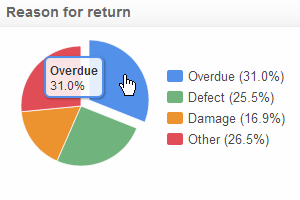 |  |  | ||
Rate of returnsThe key to this metric is providing a breakdown for the reasons why items are returned so you can identify trends and reduce your rate of return. Your KPI Dashboard will show you the principle reasons products are being returned. You can use that information to identify and resolve problems you didn't even know you had.
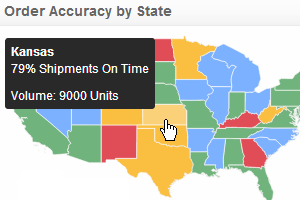
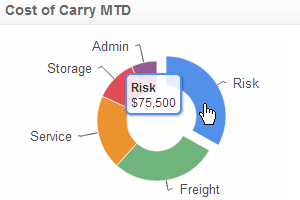
| Order trackingThis data-driven graphic monitors the status of orders on a geographic basis. This KPI Dashborrd can incorporate a variety of data points like order accuracy, shipment and delivery times, shipping errors per region, and other anecdotal information. The important thing is that this template permits you to be aware of any fluctuations or irregularities as they happen so that your company can respond appropriately. Audience: Front-line, Managers, Executives Calculation: Anecdotal information: order accuracy (# of errors per order = Order Rate %), size of order, date/time of delivery | Cost of inventoryThe cost of your inventory is more than the price you paid for it. This KPI Dashboard graphic keeps you abreast of all of the factors of the carrying cost of your inventory. You may not need this information on a daily basis, but it is always there when you do need it.
|
| Dashboard Information | Industry Dashboards | Department Dashboards | About Us | Legal |
| Connect Your Data Visualize Your KPIs Monitor Your KPIs Share With Colleagues Cloud Hosted Data Security Mobile Access Real-Time Data Visibility Operational Intelligence Consolidate Key Metrics | Call Centre Dashboards Retail Dashboards Financial Services Dashboards Insurance dashboards Health Care / Medical Dashboards Manufacturing / Supply Chain Dashboards | Sales Dashboard Marketing Dashboard Executive Dashboard Web / Social Dashboards | Professional Services Klipfolio Partnership Contact us | Privacy Policy Terms and Conditions Data Security |
| Copyright © 2016 Data Geeks. All Rights Reserved. |  | |||