
| ||||||
 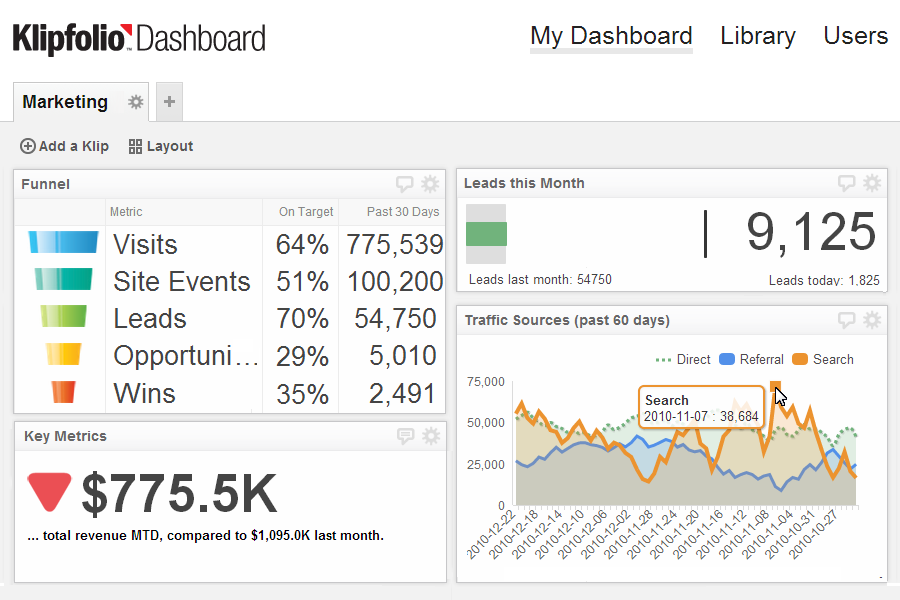 |  | 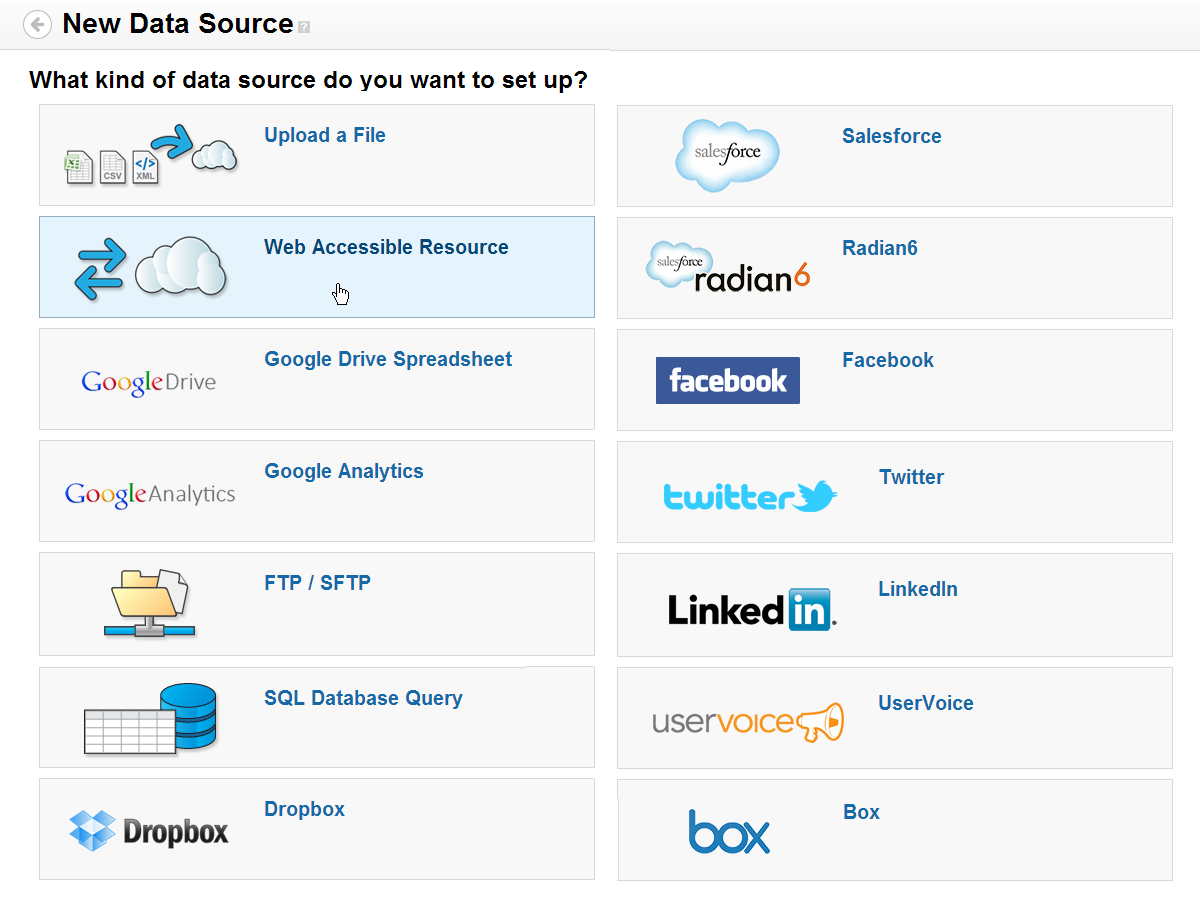 | ||
Monitor your performance in real timeYour KPI Dashboard graphics let your monitor your performance in real time. Data doesn't just become available. It becomes available right now. It's real-time data that revolutionizes the capability of any marketing campaign.. | Data-driven overviewSuccessful marketers understand that each campaign is only one piece of a much larger puzzle. A marketing KPI Dashboard helps you see the big picture. For example, you can now see how a lead comes through your social channels to your website, right up to the point where your sales team converts the lead into a win. | Automated data retrievalYour KPI Dashboard can connect to virtually any resource to consolidate multiple, disparate data sources on a single dashboard. You can automate the retrieval process so you only have to build a report once to allow you to access the most current information at any time. |
| ||||||
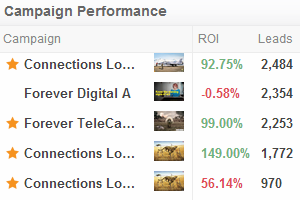 | 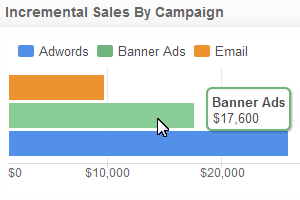 | 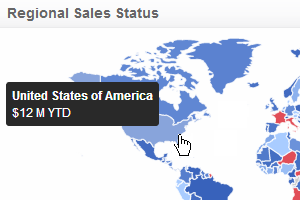 | ||
Return on investmentThis example provides an honest assessment of your performance so you know which campaigns are generating the most revenue. ROI is one of the definitive measurement to use when assessing the real success of your campaign. This KPI Dashboard template gives you the ROI information you need on a real-time basis. Audience: Media/Ad, Managers, Executives Calculation: (Attributable Revenue - Campaign Investment) / (Campaign Investment) = ROI (over X time period) | Incremental salesYou've got to understand which promotions work and which ones don't. When combined with additional data captured on your KPI Dashboard, you will be able to plan and execute marketing campaigns more successfully. Audience: Media/Ad, Managers, Executives Calculation: (Revenue generated by marketing initiatives - Baseline sales) | Regional salesDate-driven, dynamic mapping helps you to visualize and compare sales results from regions all over the globe. You don't have to spend time creating these powerful graphics. Your KPI Dashboard does it for you. Audience: Product/Brand, Copy, Research, Media/Ad, Communications, Managers Calculation: Depending on campaign - # of leads generated / # of contacts made |
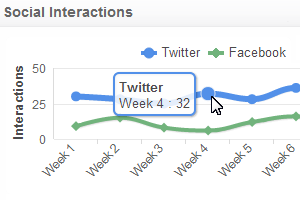 | 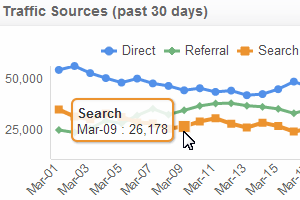 | 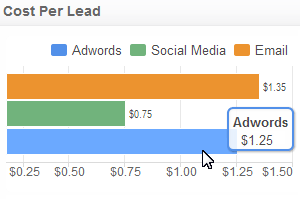 | ||
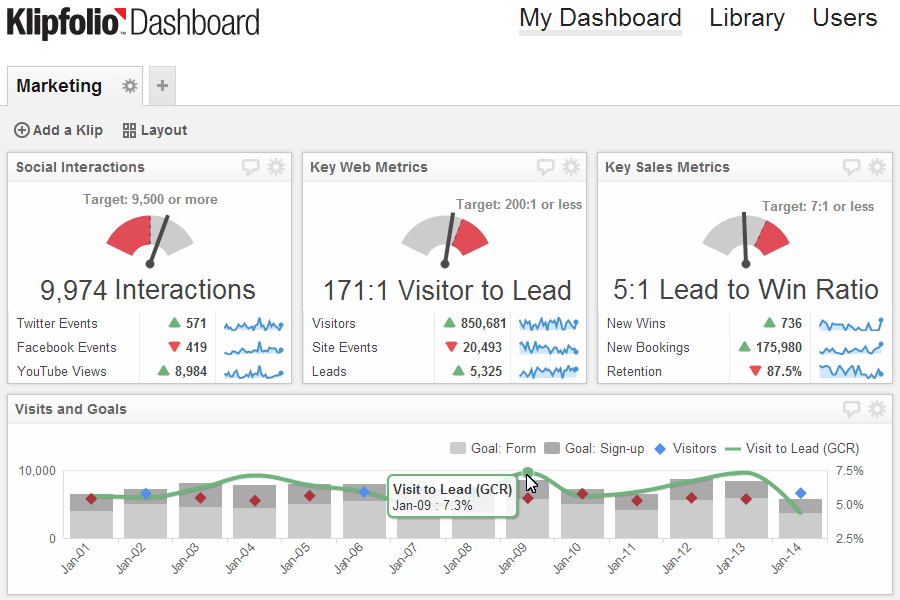
Social interactionsThis screen provides you with a measure of how effective your social-media marketing efforts are at engaging your audience. You can quantify interactions such as likes, retweets, and +1s, then use them as the basis for creating social media KPI Dashboards. Audience: Communications, Media/Ad, Managers Calculation: # of valuable social interaction summarized over X period | Traffic sourcesDisplay the answer to , "Where is my traffic coming from?" Whether you want a high-level overview or you want to break it down to more specific details, your KPI Dashboard allows you to do so quickly and easily. This screen can be used to track referral visits and identify them based on categories by source, such as Facebook, Twitter, Google+ or Pinterest. Audience: Communications, Managers, Web Analytics Calculation: # of visitors for each source | Cost per leadDo you need to focus on cost per lead generated? Your KPI Dashboard can do that. Even if you have a pet project that you are particularly attached to, you need to be able to justify the time and money spent on that campaign with hard data. This screen can tell you if you campaign is being successful or if you need to go back to the drawing board. Audience: Event, Communications, Media/Ad, Managers, Executives Calculation: Total cost of campaign / # of leads generated |
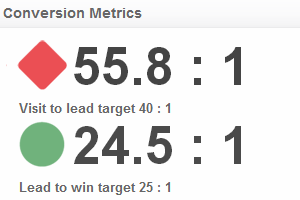 | 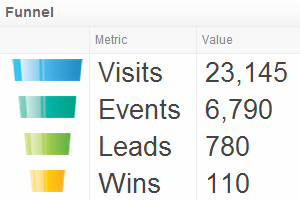 | 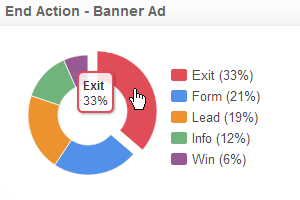 | ||
Conversion ratesThis KPI Dashboard template will help you to know how successful your organization is at converting prospects into customers. Having this information will help you to understand how to reach potential buyers and turn them into regular customers. Audience: Web analytics, Managers, Executives Calculation: # of visits / # of leads and # of leads per channel / # of wins | Funnel visualizationThis visualization helps you to see the trickle down statistics so that you can see the effectiveness of your campaigns. They won't always have the same results, so your data-driven KPI Dashboard can help you to determine where you are being the most effective. Audience: Research, Sales, Brand/Product, Managers, Executives Calculation: For each step of funnel, show relevant metrics (eg: conversion rate) | End action rateThis KPI Dashboard provides insight into what action people complete when they respond by visiting your website because of a campaign. If you are running a banner ad campaign with a specific landing page, you can use this KPI to determine how effect the landing page is at getting visitors to perform a desired action. This graphic representation allows you to understand where in the process you may be losing potential sales. Audience: Product/Brand, Copy, Research, Media/Ad, Communications, Managers Calculation: # of users that start activity / # of users that complete activity = End Action Rate |
| Dashboard Information | Industry Dashboards | Department Dashboards | About Us | Legal |
| Connect Your Data Visualize Your KPIs Monitor Your KPIs Share With Colleagues Cloud Hosted Data Security Mobile Access Real-Time Data Visibility Operational Intelligence Consolidate Key Metrics | Call Centre Dashboards Retail Dashboards Financial Services Dashboards Insurance dashboards Health Care / Medical Dashboards Manufacturing / Supply Chain Dashboards | Sales Dashboard Marketing Dashboard Executive Dashboard Web / Social Dashboards | Professional Services Klipfolio Partnership Contact us | Privacy Policy Terms and Conditions Data Security |
| Copyright © 2016 Data Geeks. All Rights Reserved. | ||||