
| ||||||
  |  | |
Around-the-clock visibilityThe world's most profitable financial companies operate a performance-driven culture. On a KPI Dasboard executives can effectively consolidate and display sales, risk, debt, and equity metrics. Managers can monitor their sales, receivables, client risk profiles, new customers, and churn. KPI Dashboards are available to for every department and at every level. | Real time operational KPIsKPI Dashboards make it easy to monitor KPIs with elegant, graphic presentations that are available as a sidebar on employee desktops, the trading floor, the boardroom, or on your mobile tablet or smartphone. Real-time metrics are available at all times. |
| ||||||
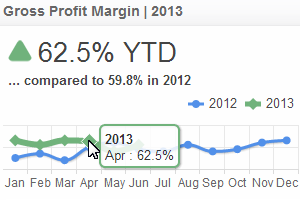 |  |  | ||
Gross marginThis KPI Dashboard shows you how much you make on each dollar of sales before expenses. You know what gross margin you need overall. This graphic shows you if you are on target.
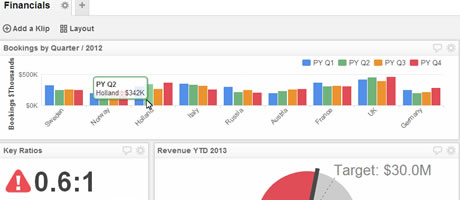
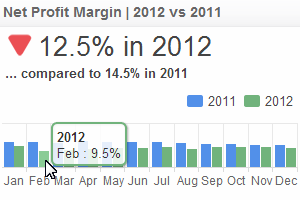
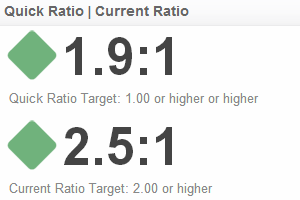
| Net profitThis graphic is designed to display your net pre-tax profit for a specified period of time and allows you to compare your past and current performance. Audience: Executives, Managers. Calculation: Net Income / Sales | Current debt ratioThis graphic displays the standard measurement of your current assets and liabilities - something that you are used to seeing on your balance sheet. It's now available on your KPI Dashboard 24/7.
|
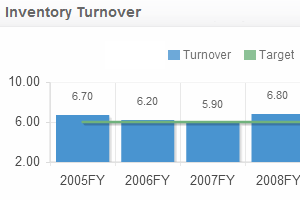 |  |  | ||
Inventory turnoverInventory turnover is one of the important, yet one of the most neglected performance metrics. With a KPI Dashboard you can raise awareness at all levels of the company, especially in Purchasing and in Sales.
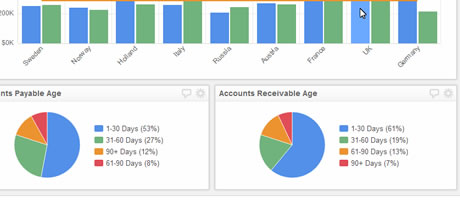
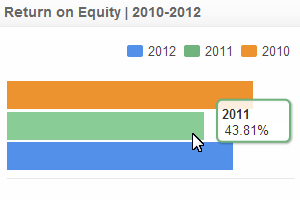
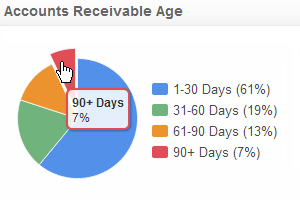
| Return on equityThis KPI Dashboard template helps you and your equity partners readily see how much profit you are generating versus average shareholder equity. You can make this information available to all of your equity partners at any time of day or night. Audience: Executives, Managers. Calculation: Net Income (After Taxes) / Average Shareholder Equity | Accounts receivable agingCredit managers love to remind the sales staff that he sale is not complete until the payment is in hand. Your KPI Dashboard can keep everyone in the process abreast of the current status of your receivables.
|
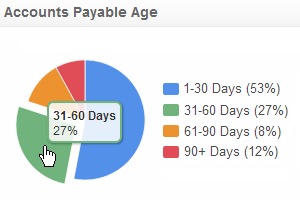 |  |  | ||
Accounts payable agingKeeping a close eye on your payables' aging will help to ensure that your suppliers are happy. Having this graphic KPI Dashboard available can alert you to potential problems and allow you avert them before they happen.
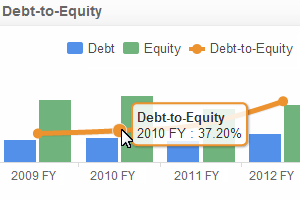
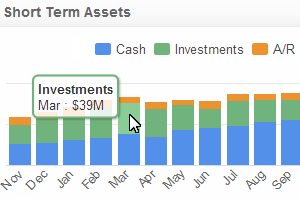
| Debt-to-equity ratioMost businesses acquire debt as a means of growth. Debt is a liability. Being able to monitor your debt to equity at any time and on any device, in the office or on the road, was unthinkable just a few years ago. With this graphic you can view it any time you like. Audience: Executives, Managers, Bank and Lenders. Calculation: Total Liabilities / Shareholders Equity | Short term assetsLiquidity is often overlooked on a day to day basis, simply because it looks like things are going well. This template on your KPI Dashboard gives you a real-time picture of where your company stands.
|
| Dashboard Information | Industry Dashboards | Department Dashboards | About Us | Legal |
| Connect Your Data Visualize Your KPIs Monitor Your KPIs Share With Colleagues Cloud Hosted Data Security Mobile Access Real-Time Data Visibility Operational Intelligence Consolidate Key Metrics | Call Centre Dashboards Retail Dashboards Financial Services Dashboards Insurance dashboards Health Care / Medical Dashboards Manufacturing / Supply Chain Dashboards | Sales Dashboard Marketing Dashboard Executive Dashboard Web / Social Dashboards | Professional Services Klipfolio Partnership Contact us | Privacy Policy Terms and Conditions Data Security |
| Copyright © 2016 Data Geeks. All Rights Reserved. | ||||