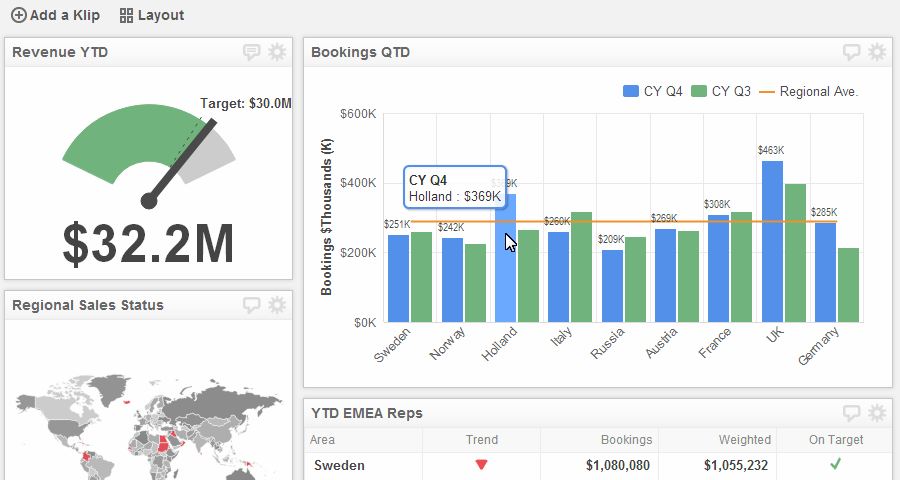
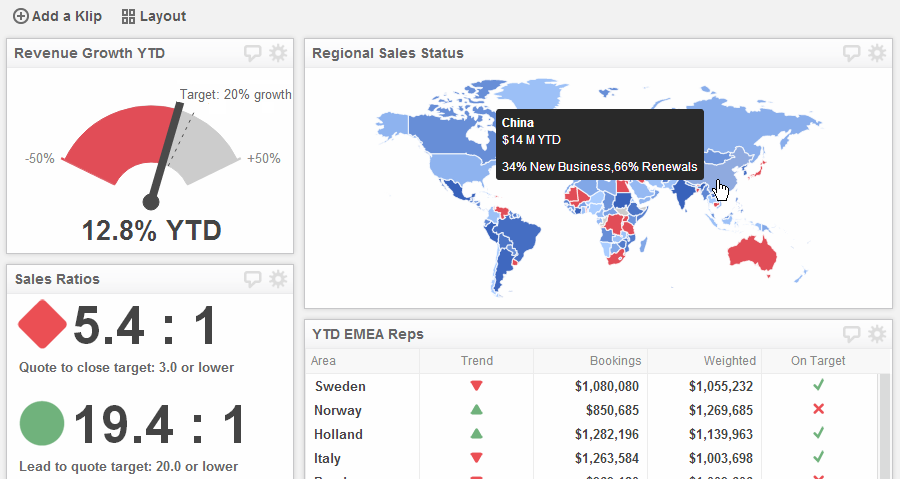
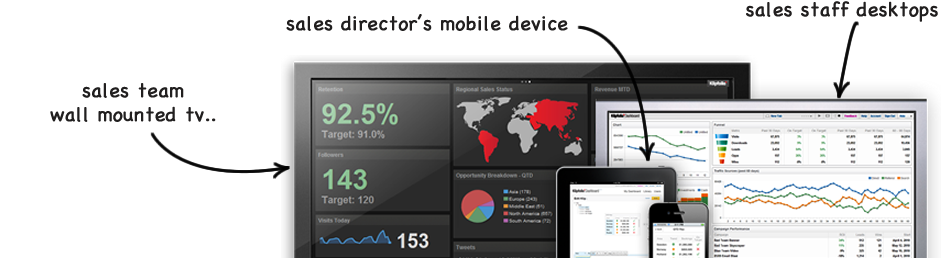
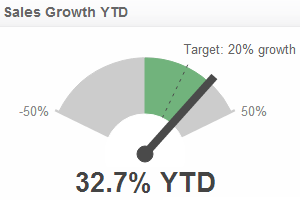
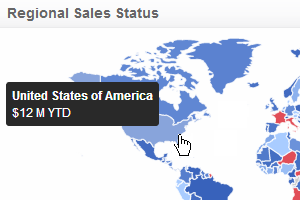
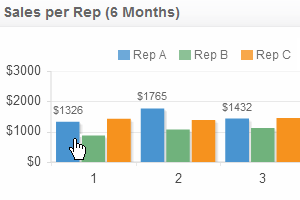
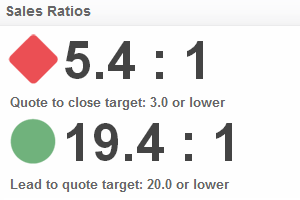
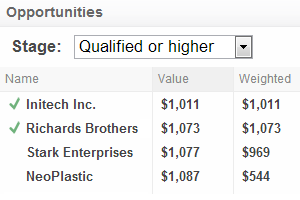
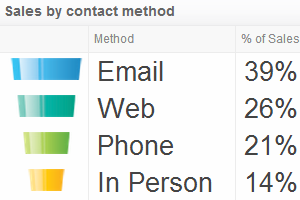
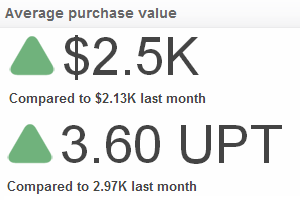
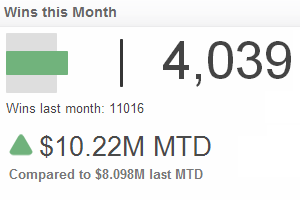
Real Time Performace Dashboards
Menu
  • External link opens in new tab or window
    • External link opens in new tab or window
    • External link opens in new tab or window
    • External link opens in new tab or window
    • External link opens in new tab or window
    • External link opens in new tab or window
    • External link opens in new tab or window
    • External link opens in new tab or window
    • External link opens in new tab or window
    • External link opens in new tab or window
    • External link opens in new tab or window
    • External link opens in new tab or window
  • External link opens in new tab or window
    • External link opens in new tab or window
    • External link opens in new tab or window
    • External link opens in new tab or window
  • External link opens in new tab or window
    • External link opens in new tab or window
    • External link opens in new tab or window
  • External link opens in new tab or window
    • External link opens in new tab or window
    • External link opens in new tab or window


Sales Dashboards. Empower your sales team with a real-time, data-driven, web and mobile dashboard.


Sales teams thrive under pressure. It brings out their competitive nature and motivates them to sell more product, convert more leads, and outperform the competition. A sales KPI Dashboard complements this nature by giving your team the facts that they need to know to see where they are in the race.
     
External link opens in new tab or window
 External link opens in new tab or window
 

Reporting with Real-time Data


Your KPI dashboard helps your sales force to measure their personal and corporate performance.  Managers will know which salesmen need the most coaching or which issues should be given the most attention.  It's real-time data that revolutionizes the capability of any sales force.


Motivate Staff with Performance Data


More than any other department, you depend on your sales team to be dynamic and self-directing. A web and mobile based KPI Dashboard gives your sales team the ability and confidence they need to make decisions whenever and wherever they need to be made.
 

Hit More Targets - Know Your Target


Sales people are inherently competitive. Give them a target and they'll do everything in their power to hit it. Our sales Dashboard displays key performance indicators so your sales team can measure their progress and make the adjustments needed to hit more targets, convert more leads, and generate more business.


KPI Examples. Sales Metrics and KPIs.


The competitive nature of business makes it essential that your sales team has an accurate view of their performance. The days of relying on "gut feel" are gone. Maintaining a competitive edge is about having a real-time, data-driven environment. The KPI Dashboard system can keep you better informed and ahead of your competition.

We've asssembled some examples KPI Dashboards available to you. You'll be amazed at what they can do for you.


External link opens in new tab or window
 External link opens in new tab or window
  External link opens in new tab or window

Product performance

.
This template ranks your products or product groups based on revenue generation, so you know which are selling well and which need to be reassessed. Variations can be used to indicate other metrics such as top performing sales reps, or slow moving products. Your KPI Dashboard keeps this information up-to-date and available at all times.

Audience: Sales Reps, Managers, Executives
Calculation: Rank top 3/10/25 performers by sales revenue


Sales growth.


This dashboard graphic indicates the pace at which your organization is growing. Rapid growth can put you out of business more quickly that slow growth.  Your accounting department understands the potential downsides of either issue.  Keep them and yourself on track with this KPI Dashboard.

Audience: Sales Reps, Managers, Executives
Calculation: Previous period sales revenue / Current period sales revenue


Demographics.


Demographic information is a dish best served graphically.  This tool is available on your sales KPI Dashboard, giving you a real picture of your customer base and distribution activity.  This is a powerful tool for strategic planning.

Audience: Sales Reps, Managers, Executives
Calculation: Total revenue per demographic (age, sex, location, etc)


External link opens in new tab or window
 External link opens in new tab or window
  External link opens in new tab or window

Sales per rep


With a KPI Dashboard comparison of sales by sales rep you will be able to better understand where you need to focus your attention to improve your business.  You will also be able to see cycles and patterns that affect one or all of your sales reps.

Audience: Sales Reps, Managers, Executives
Calculation: Actual sales per rep per time period


Quote to close ratio


By measuring the rate of issuing formal quotes compared to sales closed as a result of those quotes, you can soon determine if and why you are losing sales on certain products or to selected customers.  The KPI Dashboard data can help you hone in on gaining business that you may be losing.

Audience: Managers, Executives
Calculation: # of quotes / # of wins


Opportunities


This screen organizes each opportunity your sales team is cultivating and assigns them a status value such as "qualified" or "proposal." Each opportunity has an associated estimated value, so sales reps can prioritize their time according to either the the likelihood or the significance of a sale or a customer gained. Data-driven, real-time KPI Dashboard monitoring allows your sales team to be aware of where they will get the most return.

Audience: Sales Reps, Managers, Executives
Calculation: Value of Sale * Opportunity Status Percentage


External link opens in new tab or window
 External link opens in new tab or window
  External link opens in new tab or window

Sales by contact method


This KPI Dashboard graphic reveals the effectiveness of each contact method versus the others.  This data-driven graphic can be modified to reflect percentage of total sales or actual sales volume by method.

Audience: Sales Reps, Managers, Executives
Calculation: Sales per contact method / Total revenue


Average purchase value


Use the versatility of your KPI Dashboard to monitor the average value of each sale. This can be integrated with other key metrics, like units-per-transaction, to provide a more in-depth view of sales trends for individual customers, regions, products or company-wide sales.

Audience: Sales Reps, Managers, Executives
Calculation: Total sales / # of sales = Average sale value
 

Wins this month


You've set the sales goal for your team and you've made it visible. With this KPI Dashboard graphic you can keep them informed of their progress on a real-time basis.  There's no need for phone calls to ask, "Are we there yet?"  Now they can know exactly where they are at all times.

Audience: Sales Reps, Managers, Executives
Calculation: New wins MTD vs quota MTD or wins previous MTD


Sales Dashboards - Data From Anywhere.
Connect any data source.


We've made it easy to get your data into your Sales Dashboards. Choose from Excel, Google Docs, Salesforce, Netsuite. Basically we can link into any reporting data you currently use.


External link opens in new tab or window
 External link opens in new tab or window
  External link opens in new tab or window

Your data - your dashboard.


Whatever internal platforms or systems you use, you can have the data feed directly into your dashboards. We feature plugins for all major services including Google, Dropbox, Box, Email, Salesforce, Facebook, and direct database connections.
 

Start with spreadsheets

You can upload your Excel files into your KPI  Dashboard and start seeing your spreadsheets in minutes. You can even automate the entire process using popular file-sharing services like Dropbox or Box.com.
 

Google Drive compatible


If you use Google Drive, you can instantly and securely connect to your Google spreadsheets.


External link opens in new tab or window
 External link opens in new tab or window
  External link opens in new tab or window

Automated data retrieval


You determine the refresh rate for your data. Anytime your KPI Dashboard detects a change in the information, those changes will be reflected on your dashboard in real time.


Common file format support
Your KPI Dashboard supports all commonly used formats, such as XML, JSON, CSV, and Excel (.XLS / .XLSX).


Query your SQL database


You will be able to securely connect to your SQL databases and, not only view the information, but easily execute queries to retrieve the data you want to be visible on your KPI Dashboard.


Consult a geek & increase sales with dashboards!

Complete the form below and one of our geeks will show you how we can ramp up your sales with dashboards!


Our geeks bring best practices design, development, and deployment of sales dashboards. Backed by a wealth of experience, our consultants are dedicated to ensuring that your sales dashboard encourage healthy competition and motivate productive behaviours.


Dashboard InformationIndustry DashboardsDepartment DashboardsAbout UsLegal
Connect Your Data
Visualize Your KPIs
Monitor Your KPIs
Share With Colleagues
Cloud Hosted
Data Security
Mobile Access
Real-Time
Data Visibility
Operational Intelligence
Consolidate Key Metrics
Call Centre Dashboards
Retail Dashboards
Financial Services Dashboards
Insurance dashboards
Health Care / Medical Dashboards
Manufacturing / Supply Chain Dashboards
Sales Dashboard
Marketing Dashboard
Executive Dashboard
Web / Social Dashboards
Professional Services
Klipfolio Partnership
Contact us
Privacy Policy
Terms and Conditions
Data Security  
     
Copyright © 2016 Data Geeks. All Rights Reserved.
 

close lightbox