Real Time Performace Dashboards
Menu
  • External link opens in new tab or window
    • External link opens in new tab or window
    • External link opens in new tab or window
    • External link opens in new tab or window
    • External link opens in new tab or window
    • External link opens in new tab or window
    • External link opens in new tab or window
    • External link opens in new tab or window
    • External link opens in new tab or window
    • External link opens in new tab or window
    • External link opens in new tab or window
    • External link opens in new tab or window
  • External link opens in new tab or window
    • External link opens in new tab or window
    • External link opens in new tab or window
    • External link opens in new tab or window
  • External link opens in new tab or window
    • External link opens in new tab or window
    • External link opens in new tab or window
  • External link opens in new tab or window
    • External link opens in new tab or window
    • External link opens in new tab or window


Improve Operational Efficiency. You are now able to improve operational efficiency in minutes rather than days.


When your KPI Dashboard is up and running, people at every level of your organization will be able to see the data that they need to improve their performance. Real time information can drive strategic change at the executive level as well as tactical movement on the front lines of your organization.


Streamline your operational performance


Whether you're on the factory floor, the sales department, or in the executive suite, streamlining the tasks and processes you do everyday is an efficient way to boost your productivity. Automating data recovery and KPI-reporting frees up your most valuable resources – your people – to spend more time improving productivity.
 

Operational visibility on the desktop


Automating the tracking and reporting of your operational performance data is a necessity, but it's not a solution. To gain the benefit of your operational performance systems investment, the data you capture must be presented in a format in which your people can't miss the point.


KPI Dashboard for operations


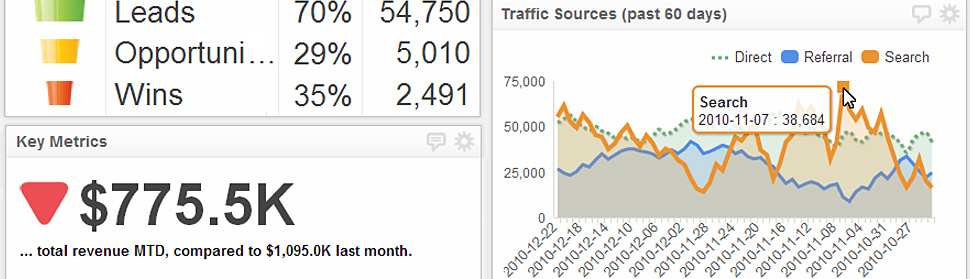
By eliminating all of the unnecessary data, and by graphically displaying the  most important information, you will better inform your employees.  Your KPI Dashboard presents the data quickly and clearly with easy-to-understand graphics.

Imagine your complete operational performance available in the right perspective at every level of your company.  You can make the big picture available to the people in the corner offices and the operation-specific data available to all the employees on the floor and front lines.  They will see what you want them to see - the details that they need to see in order to succeed.  You'll be able to give directions to help them meet their goals instead of having to reprimand them for missing opportunities that they could not heretofore see.


Next Page: Consolidate Key Metrics


Dashboard InformationIndustry DashboardsDepartment DashboardsAbout UsLegal
Connect Your Data
Visualize Your KPIs
Monitor Your KPIs
Share With Colleagues
Cloud Hosted
Data Security
Mobile Access
Real-Time
Data Visibility
Operational Intelligence
Consolidate Key Metrics
Call Centre Dashboards
Retail Dashboards
Financial Services Dashboards
Insurance dashboards
Health Care / Medical Dashboards
Manufacturing / Supply Chain Dashboards
Sales Dashboard
Marketing Dashboard
Executive Dashboard
Web / Social Dashboards
Professional Services
Klipfolio Partnership
Contact us
Privacy Policy
Terms and Conditions
Data Security  
     
Copyright © 2016 Data Geeks. All Rights Reserved.
 

close lightbox